Tableau Online Course
(All course fees are in USD)
Course Description
The Tableau Online Training helps you learn how to build visualizations, organize data, and design dashboards to empower more meaningful business decisions. You will gain exposure to the concepts of statistics, data mapping, and establishing data connections and be prepared for the Tableau Desktop 10 Qualified Associate exam.
Offered in Conjunction with
Simplilearn
Course Delivery
Applied Learning: 56 hours
Benefits
Tableau has regularly been ranked as a “leader” in the Gartner Magic Quadrant for Analytics and Business Intelligence Platforms. Proficiency in Tableau is extremely valued in the field of analytics as it is a preferred reporting tool for enterprises around the world.
Skills to be Learned
- Tableau statistics
- Building interactive dashboards
- Arithmetic logical LOD calculations
- Heat map waterfall Pareto
- Clustering forecasting techniques
- Custom geocoding radial selections
- Special field types
Award upon Successful Completion
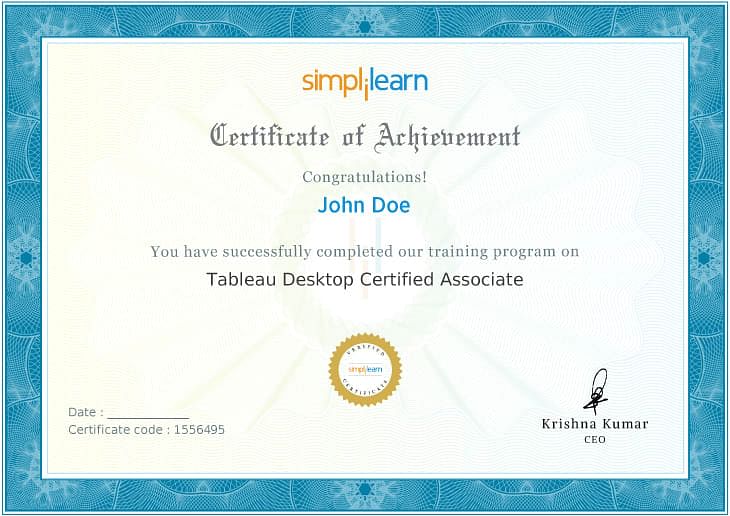
Tableau Desktop Certified Associate “Certificate of Achievement”
Awarding Organisation
Simplilearn
Certification Alignment
This course would prepare you for the Tableau Desktop Certified Associate exam.
Learning Outcomes
By the end of this Tableau training, following are expected to be accomplished:
- Become an expert on visualization techniques such as heat map, treemap, waterfall, Pareto
- Understand metadata and its usage
- Work with Filter, Parameters, and Sets
- Master special field types and Tableau-generated fields and the process of creating and using parameters
- Learn how to build charts, interactive dashboards, story interfaces, and how to share your work
- Master the concepts of data blending, create data extracts and organize and format data
- Master arithmetic, logical, table, and LOD calculations
Assessments
Course-end Quizzes
Industry Projects
Project 1 – Sales Performance Analysis
Build a dashboard to present monthly sales performance by product segment and product category to identify the areas that have met or exceeded their sales targets.
Project 2 – Customer Analysis
Build a dashboard that presents statistics about the customers, ranking of them by profit ratio and sales plus the profit performance by region.
Project 3 – Product Analysis
Build a dashboard that presents sales by product category over time, with the ability to drill down to the product and regional level to check if the products are correctly priced.
Project 4 – Sales Dashboard
Build a dashboard that presents metrics about products (like sales, profits, profit ratio) and the trends of statistics over time, filtering down to one or more geographic regions.
Course Completion Criteria
- Complete at least 85% of the online self-paced course
- Attendance of one live virtual classroom
- Score of at least 75% in course-end assessment
- Successful evaluation of at least one project
Who Should Enrol
- Analytics professionals
- IT developers and testers
- Data analysts
- Data scientists
- BI and reporting professionals
- Project managers
Prerequisites
There are no pre-requisites for taking this Tableau online training course.
Course Overview
Lesson 01 -Course Introduction
Lesson 02 – Introduction to Data Visualization and Tableau
Lesson 03 – Connecting to Various Data Sources and Preparing Data
Lesson 04 – Working with Metadata
Lesson 05 – Spotlight One
Lesson 06 – Filters in Tableau
Lesson 07 – Structuring Data in Tableau
Lesson 08 – Creating Charts and Graphs
Lesson 09 – Spotlight Two
Lesson 10 – Calculations in Tableau
Lesson 11 – Advanced Visual Analytics
Lesson 12 – Dashboards and Stories
Lesson 13 – Spotlight Three
Accessible Period of Course
1 year from date of enrolment
Customer Reviews
Alejandro Albarenga
My instructor, Guraraj RN, knows how to teach and engage the class. I’m so glad I have him as a teacher. He has been super inspiring in his first class, citing fantastic real-life examples and matching them to Tableau’s practical use.
Matiun Nessa Hassan
The course content is comprehensive and well structured. Our instructor, Ram is a great teacher and takes up questions from everyone in the class, and resolves them.
Ravi Chandra
Package Solution Consultant (Cognos BI) at IBM Global Services
The training was excellent. Appreciate the trainer’s capability to answer all the queries. Thanks …for such a good course content.
Sriramadevi Nanduru
Lead Consultant at Deloitte
Tableau 10 training is simple, effective and easy to learn. The course helped me grow my career from a Senior Project Engineer at SPSoft Private Ltd. to Lead Consultant at Deloitte with a salary hike.
Sukrit Vashist
Data & Insights Analyst at Westpac
The trainer has great knowledge about the subject. She interacts well with all the participants. All the queries were answered appropriately.
Ramkumar P
The training helped me learn important public tableau application features like filter, worksheet, dashboard, story, action, set, calculation, groups, maps, map layout and then, etc. I feel confident and this will help improve my performance.
Course Features
- Students 0 student
- Max Students10000
- Duration50 hour
- Skill levelall
- LanguageEnglish
- Re-take course100000
-
Lesson 1 - Course Introduction
-
Lesson 02 - Introduction to Data Visualization and Tableau
-
Lesson 03 – Connecting to Various Data Sources and Preparing Data
-
Lesson 04 – Working with Metadata
-
Lesson 05 – Spotlight One
-
Lesson 06 – Filters in Tableau
-
Lesson 07 – Structuring Data in Tableau
-
Lesson 08 – Creating Charts and Graphs
-
Lesson 09 – Spotlight Two
-
Lesson 10 – Calculations in Tableau
-
Lesson 11 – Advanced Visual Analytics
-
Lesson 12 – Dashboards and Stories
-
Lesson 13 – Spotlight Three

